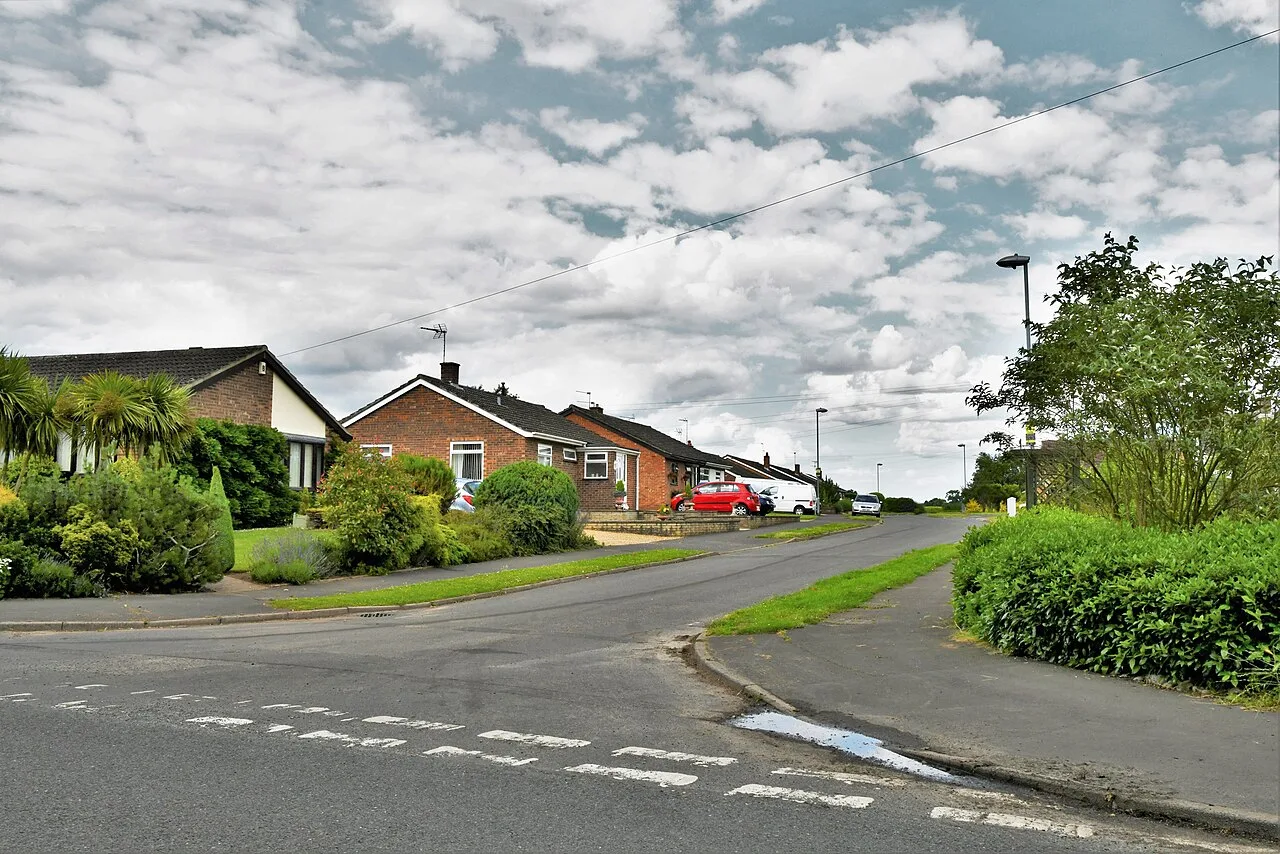

The average Broadland home hit £315,128 in June, up £21,083 in a year. That 7.2% rise is four times England's rate and the steepest of Norfolk's districts.
The average home in Broadland sold for £315,128 in June, £21,083 more than a year earlier, according to the latest UK House Price Index from HM Land Registry.
That is a rise of 7.2% in twelve months. England as a whole managed 1.8%. The East of England managed 1.1%. Broadland is running at four times the national rate, and it is now the most expensive district in Norfolk as well as the fastest-rising one.
Set against every local authority district in England, Broadland comes 28th out of 295 on annual growth. Only 29 districts reached 7.2% or better. Sixty-two of them saw prices fall over the same year.
Broadland against its neighbours
Norfolk has seven districts. On the June figures they are not remotely in the same market.
Broadland’s 7.2% is not just first in Norfolk. It is double the next district, and more than four times the slowest. The full picture:
- Broadland: £315,128, up 7.2% (28th of 295 English districts)
- King’s Lynn and West Norfolk: £263,298, up 5.0% (68th)
- Norwich: £230,706, up 3.6% (122nd)
- Breckland: £273,851, up 2.7% (148th)
- Great Yarmouth: £209,164, up 2.5% (156th)
- South Norfolk: £312,124, up 2.0% (183rd)
- North Norfolk: £300,273, up 1.7% (194th)
Norfolk as a county averaged 3.6%. The UK averaged 2.0% (UK House Price Index, June 2026).
Two things the headline number hides
First, the rise has already stopped. Broadland prices did not move at all between May and June: the month-on-month change was 0.0%, after 0.9% in May and a fall of 0.3% in April. The 7.2% annual figure is measured against a weak summer last year, when the district was going backwards at 1.6% a year. Most of the climb happened between June and December 2025.
Second, Broadland is still below its own record. The district’s average peaked at £320,007 in September 2022. June’s £315,128 is £4,879 short of that, nearly four years later. A homeowner who bought at the top has not yet got back to where they started in cash terms, let alone after inflation.
What is rising, and what is not
The gain is not spread evenly across the types of home.
| Type of home | Average, June 2026 | Change on the year |
|---|---|---|
| Detached | £424,569 | up 6.7% |
| Semi-detached | £275,989 | up 7.9% |
| Terraced | £227,429 | up 7.5% |
| Flat or maisonette | £146,038 | up 4.0% |
Semi-detached and terraced homes, the stock that fills Sprowston, Thorpe St Andrew and Hellesdon, are moving fastest. Flats are barely keeping up.
The average paid by a first-time buyer in Broadland was £271,272, up 7.6% on the year. On the Bank of England’s usual assumption of a 10% deposit, that is £27,127 to find before any fees.
Sales are thin, and last year’s figures are misleading
The index publishes sale counts about three months behind the prices, so the most recent months are blank. The last complete month is April 2026, when 104 homes changed hands in Broadland, against 81 in April 2025.
Do not read across from March. Broadland recorded 382 sales in March 2025 and 139 in March 2026, but that gap is almost entirely the stamp duty threshold change on 1 April 2025, which pulled completions forward into March and then left April empty. Comparing either month with the other tells you about the tax deadline, not the market.
What it means for you
If you are selling, the district-wide figure is on your side, but the momentum is not: prices have been flat for a month and are still below the 2022 high. Price against what has actually sold nearby rather than against the annual percentage.
If you are buying, £315,128 is a mean average across a district that runs from Norwich suburbs to Broads-side villages, and it flattens a market that is really two or three markets. Our Broadland house prices page has median sold prices for 23 individual parishes, which is a far better guide to what a specific village costs.
If you are a first-time buyer, the £271,272 average is only £44,000 below the district average, because the cheapest stock is rising fastest. The gap between starter homes and the middle of the market has narrowed, not widened.
One caveat that matters. The UK House Price Index publishes a mean average, not a median. A handful of expensive sales pulls it upward in a way a median would not, which is why the district figure sits above what most Broadland homes actually sell for.
Why Broadland and not South Norfolk
The obvious question is why the district on one side of Norwich rose 7.2% while the district on the other side rose 2.0%, from a nearly identical starting price. The index does not explain itself, and we are not going to invent a reason.
What can be said from the record is that Broadland is building at pace and its market is dominated by the Norwich fringe. New roundabouts, new access roads and new estates are being signed off across Drayton, Sprowston, Rackheath and Thorpe St Andrew, which is visible in our Broadland planning news. Whether that supply is pushing the average up, by adding new-build homes that sell above the local second-hand price, or whether demand is simply stronger on this side of the city, the index cannot tell you.
Sources
- HM Land Registry UK House Price Index, Broadland, June 2026 release for the district average, annual change, type splits, first-time buyer average and sales volumes.
- UK HPI full data file, June 2026 for the England-wide ranking of all 295 local authority districts and the neighbouring Norfolk figures, all taken from the same release.
- HM Land Registry: about the UK House Price Index for the methodology, including the use of a mean average.
Have your say